Germantown, Tennessee
Special Report Archived sample

“SUPER” El Niño WHAT DOES IT MEAN?

Chris Myers, M6 Capital Management

Archived sample · September 2026. Market conditions have changed since this was written; it's shown as an example of Chris's special reports, not current commentary.

Photo: USDA NRCS / Carly Whitmore

This summer the term Super El Nino has been all over the news and blamed for nearly every odd weather occurrence in the world. The data does support El Nino was related to the lack of rainfall in India and even down into Malaysia and Indonesia the last few months. As for the rest of the blame, it seems this is climate alarmists beating their drums for anything relating to their cause and supporting data is severely lacking.

So, what is El Nino and what does it mean for the next few months? El Nino and La Nina are the names given to the cycle of warmer and cooler water in the central Pacific Ocean that can have impacts on weather throughout the world. In the image below, you can see the current sea surface temperatures and how the equatorial Pacific is currently much warmer than normal.
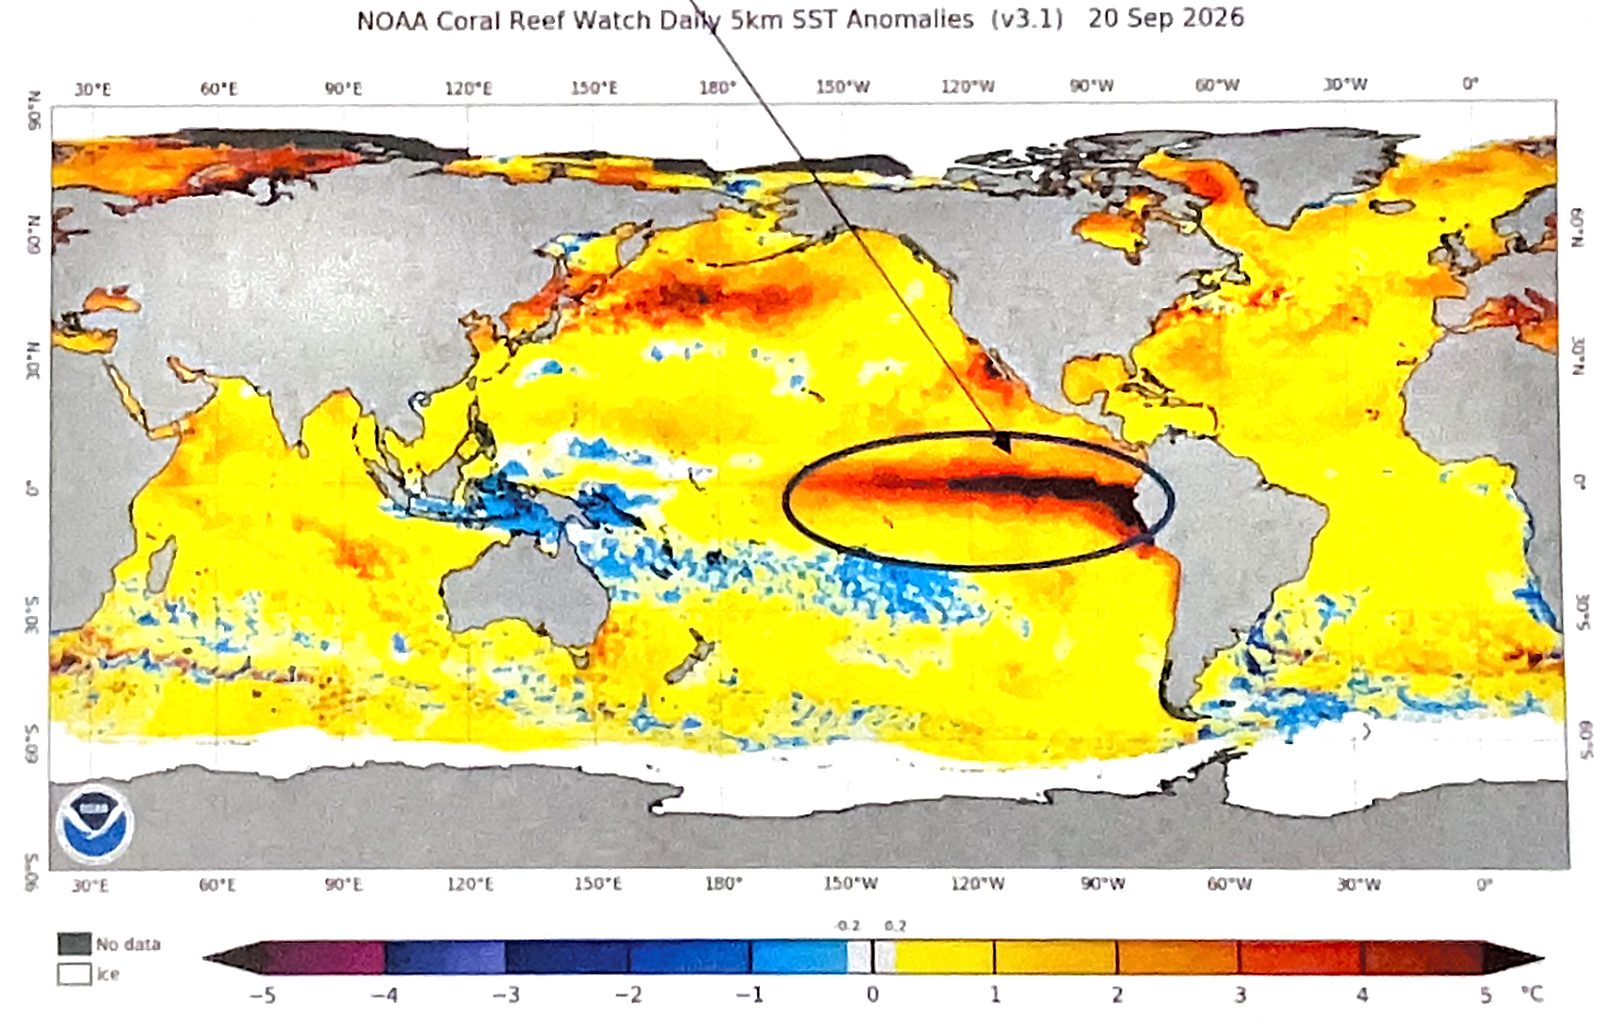
World map of sea surface temperature anomalies from NOAA Coral Reef Watch, dated 20 September 2026, on a color scale from minus 5 degrees C (purple and blue) to plus 5 degrees C (dark red). Most oceans are yellow to orange, slightly warmer than normal. A band of dark red to nearly black runs along the equator in the eastern Pacific toward South America, circled and pointed to with an arrow, showing water about 4 to 5 degrees C above normal.
Figure 1: Sea Surface Temps (SST) Anomalies (°C departure from norm) NOAA Coral Reef Watch Daily 5km SST Anomalies (v3.1), 20 Sep 2026. Circle and arrow added by Chris.

Federal meteorological departments around the world have spent lots of money studying these sea surface temperatures and trying to forecast what they will be several months out. The chart on Page 2 shows current sea surface temps are the highest EVER recorded (since decent data began in 1950) and the forecast models have temps going even higher.
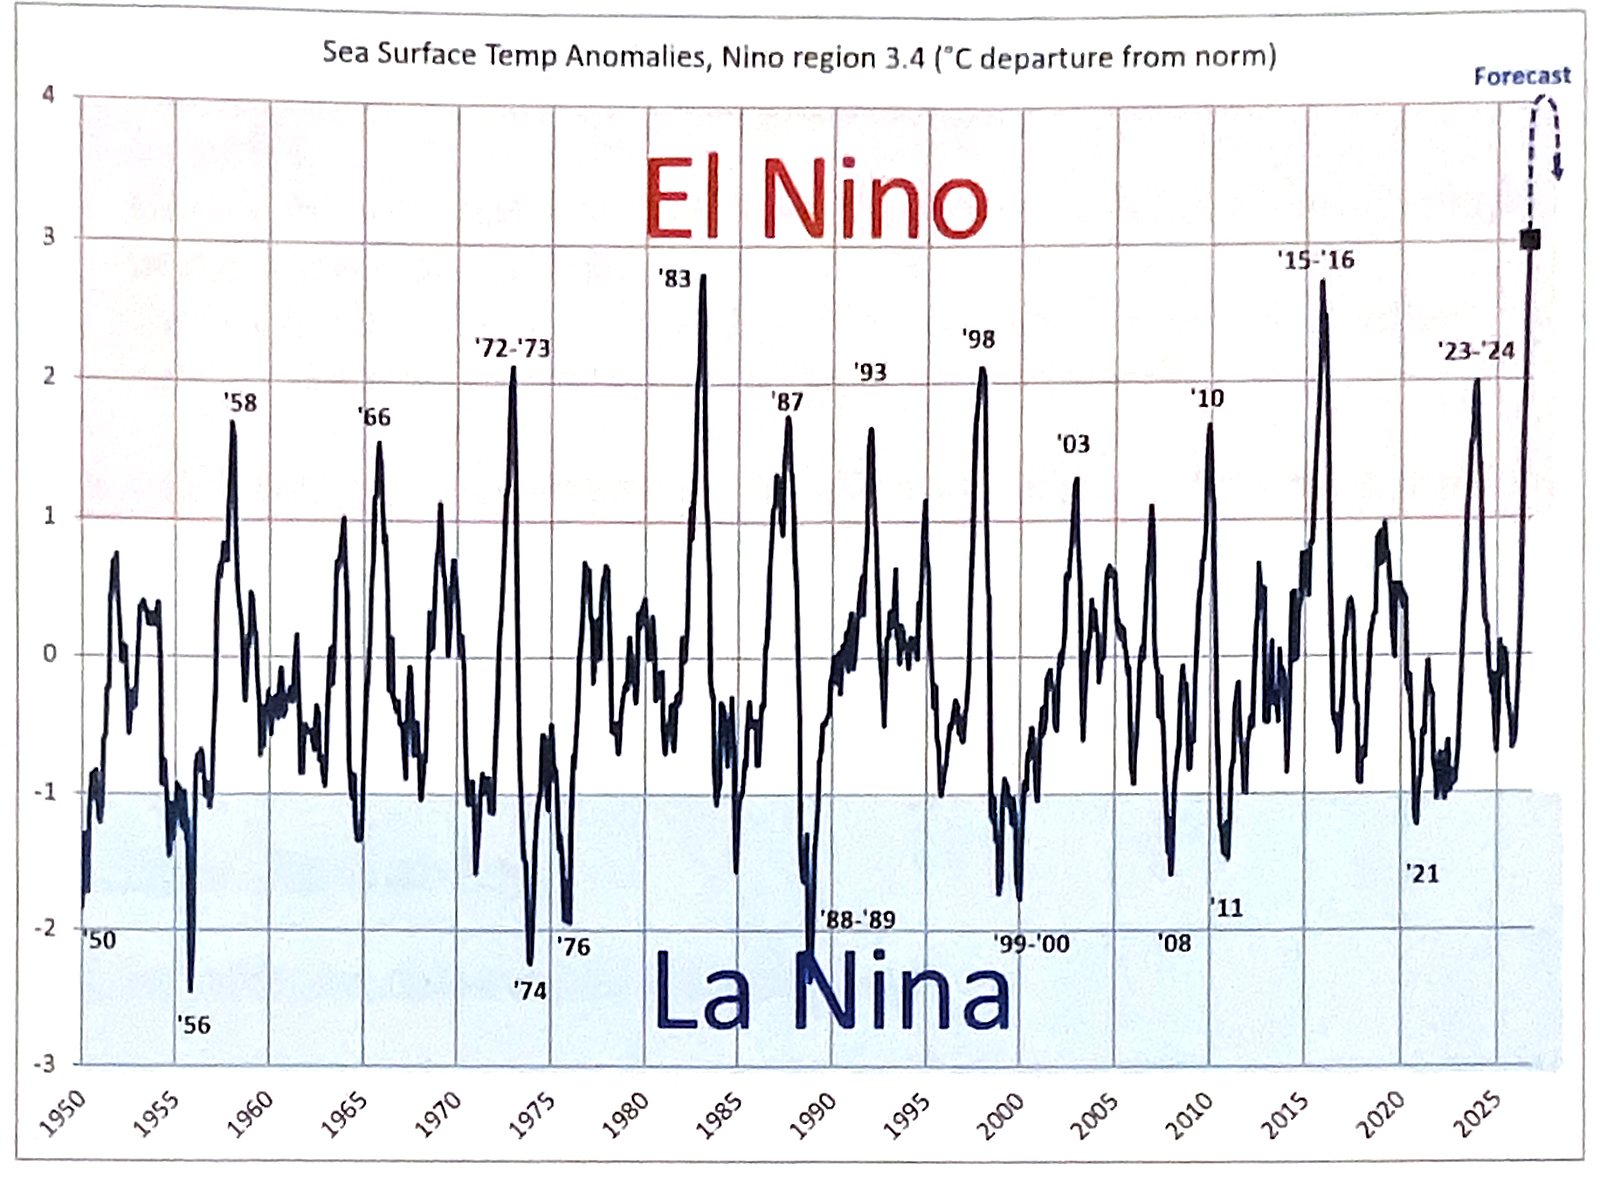
Line chart of Sea Surface Temp Anomalies, Nino region 3.4, in degrees C departure from norm, 1950 to 2026. Values above plus 1 are shaded as El Nino and below minus 1 as La Nina. Labeled El Nino peaks: '58, '66, '72-'73, '83 (about 2.7), '87, '93, '98 (about 2.0), '03, '10, '15-'16 (about 2.6) and '23-'24 (about 2.0). Labeled La Nina lows include '50, '56, '74, '76, '88-'89, '99-'00, '08, '11 and '21. The line ends in 2026 at about 3.0, the highest on the chart. From there a dashed line marked Forecast rises to the top of the chart, about 4, then hooks back down to an arrowhead near 3.5.
Figure 3: Sea Surface Temps and Forecast Sea Surface Temp Anomalies, Nino region 3.4 (°C departure from norm). Chart: M6 Capital Management.

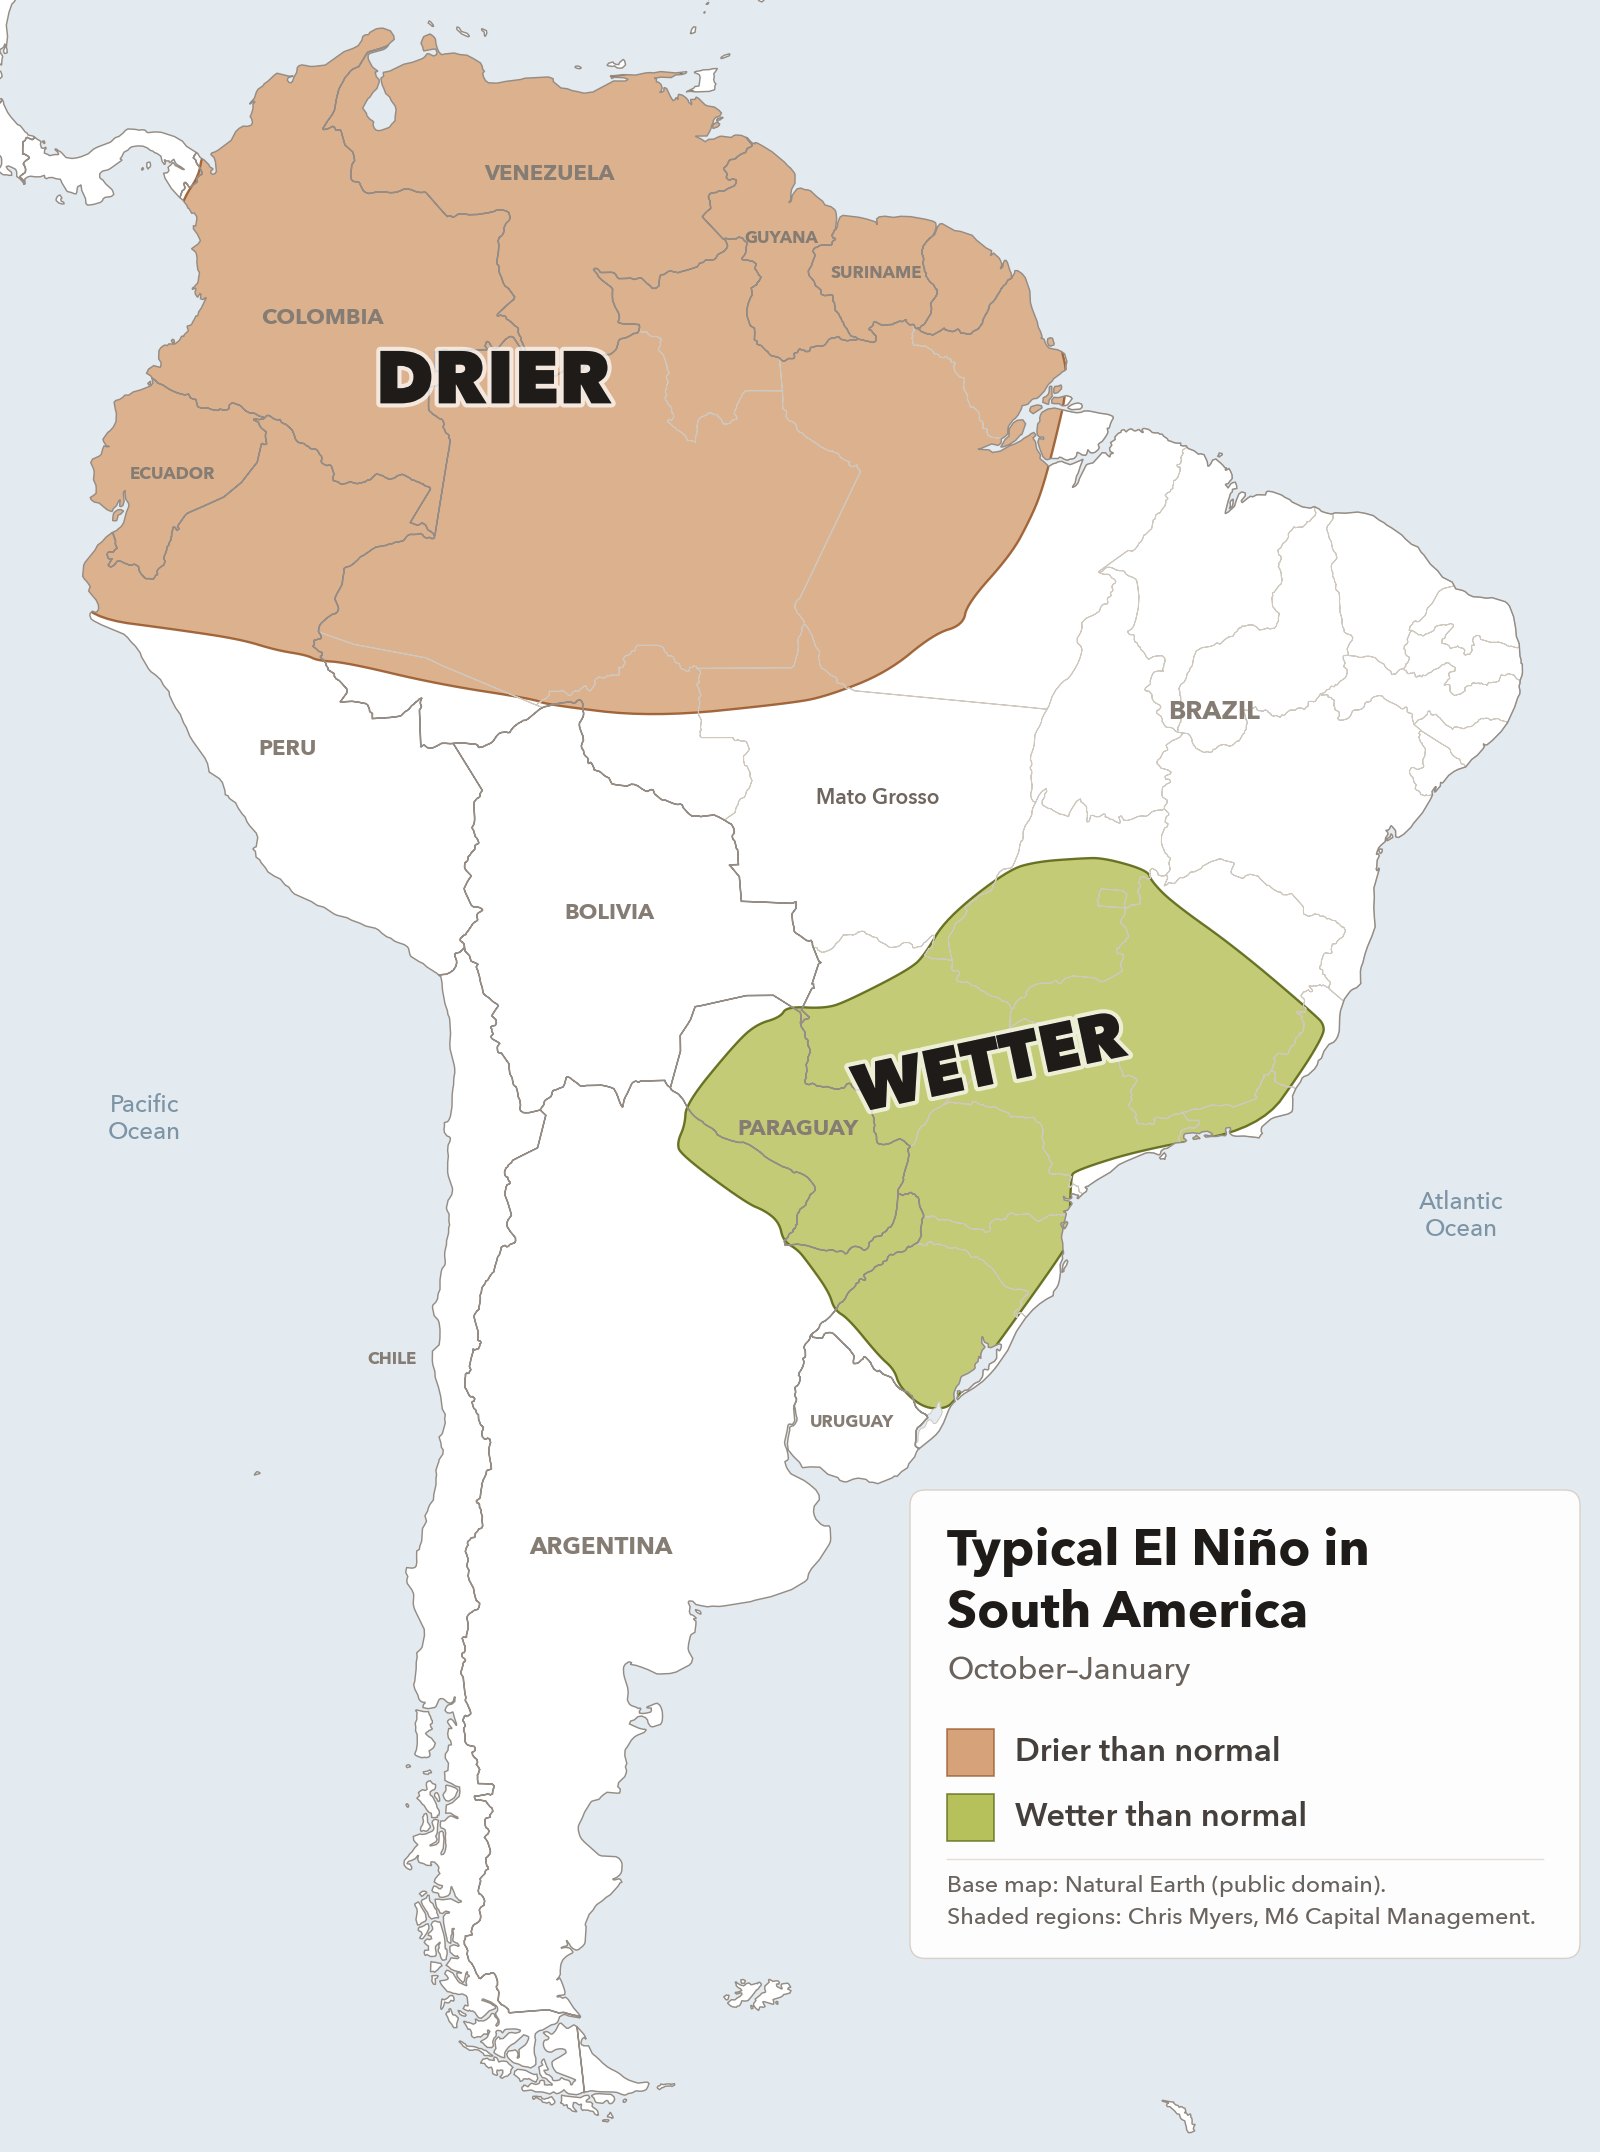
So, WHAT DOES ALL THIS MEAN FOR OUR AG MARKETS? Typically, an El Nino event during Oct-Nov-Dec-Jan period has resulted in some wetter areas for parts of North and South America, along with some areas being drier and others warmer. The maps below show these areas:
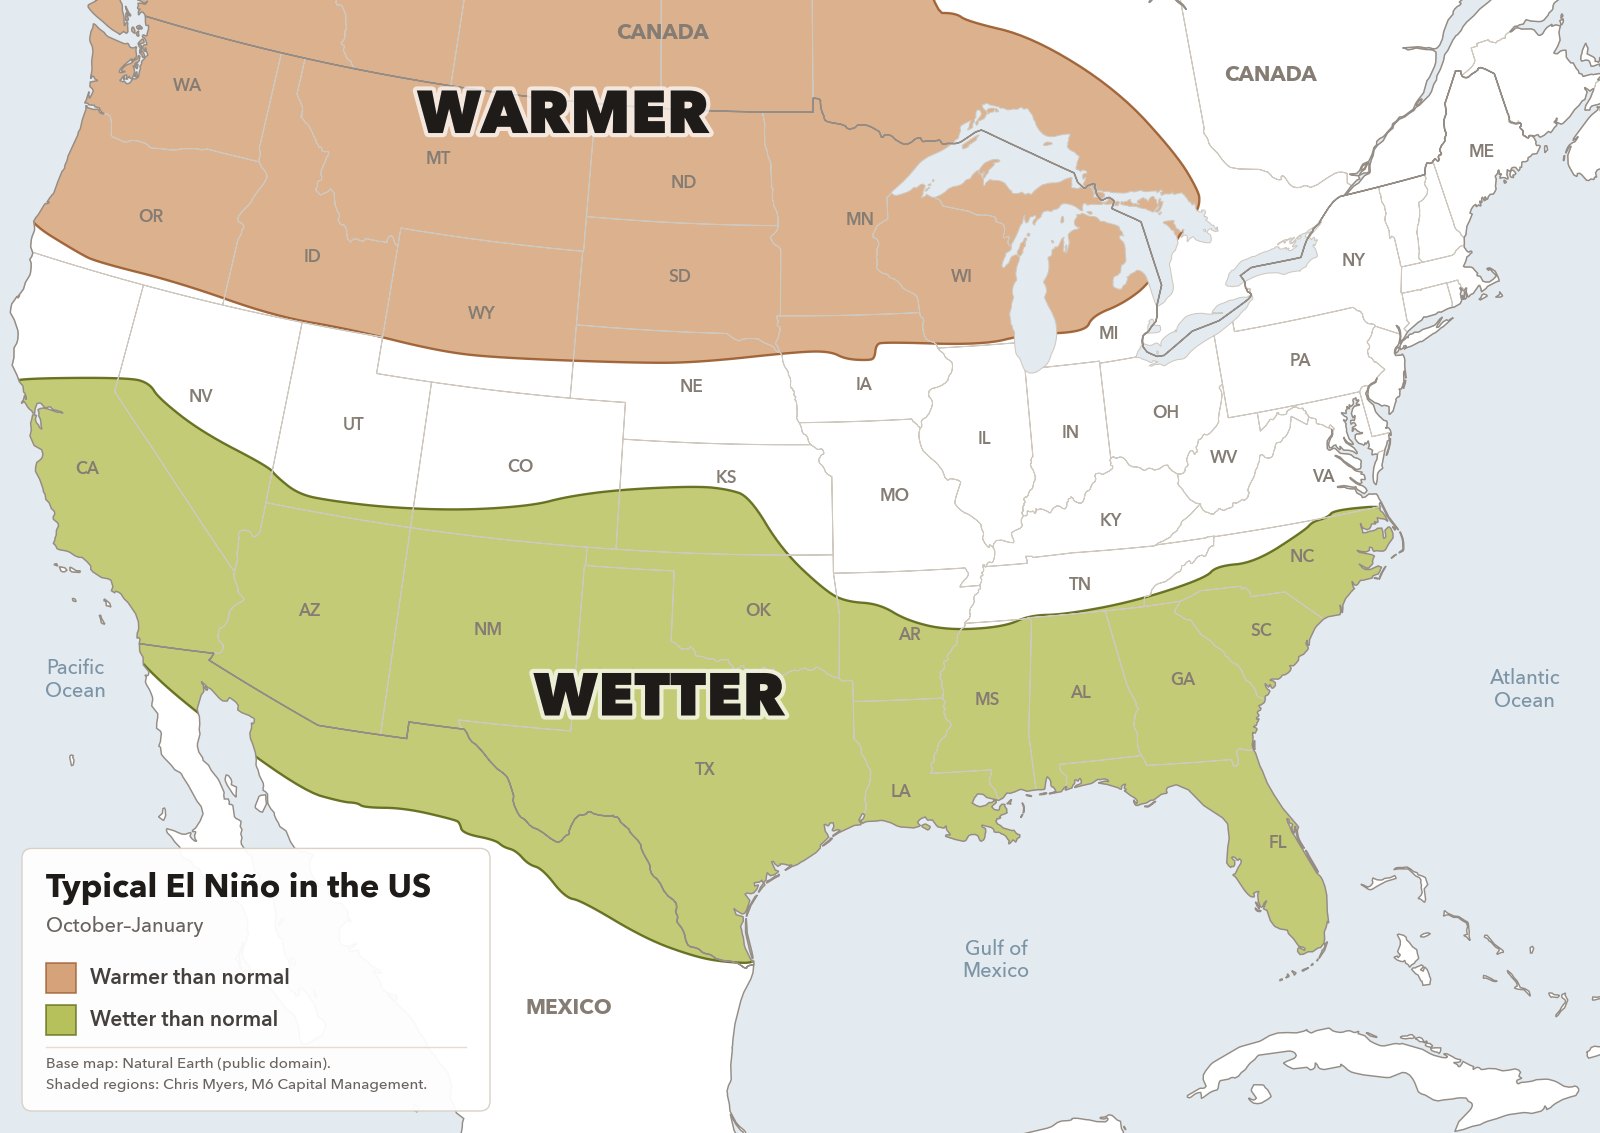
Map of the lower 48 United States with southern Canada and northern Mexico. A tan area labeled WARMER covers the northern tier: Washington, Oregon, Idaho, Montana, most of Wyoming, the Dakotas, Minnesota, Wisconsin, most of Michigan and the northern edges of Nebraska and Iowa, and it reaches north into the Canadian Prairies and western Ontario. A green area labeled WETTER covers the southern tier: central and southern California, southern Nevada, Arizona, New Mexico, southern Colorado, southern Kansas, Oklahoma, Texas, most of Arkansas, Louisiana, Mississippi, Alabama, Georgia, Florida, South Carolina and most of North Carolina, plus a strip of northern Mexico. The key reads Warmer than normal and Wetter than normal, October to January.
TYPICAL EL NINO IN THE US
Map of South America. A tan area labeled DRIER covers the north of the continent: Colombia, Venezuela, Guyana, Suriname, French Guiana, Ecuador, northern Peru and northern Brazil, reaching down to the northern tip of Mato Grosso, which is labeled on the map. A green area labeled WETTER covers south-central and southern Brazil, from just north of Brasília south through most of Goiás and Minas Gerais, Mato Grosso do Sul, São Paulo, Paraná, Santa Catarina and Rio Grande do Sul, plus most of Paraguay and a small part of far northern Argentina. The key reads Drier than normal and Wetter than normal, October to January.
TYPICAL EL NINO IN SOUTH AMERICA

Base map: Natural Earth (public domain). Shaded regions: Chris Myers, M6 Capital Management.

North America: wetter across the southern areas, and even up into cattle areas of southwest KS into the OK/TX panhandles. Warmer in northern areas in into Canadian Prairies.

South America: Typically very wet, with a decent chance of isolated flooding, in far southern Brazil, into Paraguay and far northern Argentina. Northern Brazil tends to be dry, sometimes that dryness comes down into Mato Grosso (the largest soybean producing state in Brazil).

So, here are the ag market implications:

  1. Wet weather in US feedlots. Could this take weight off these super heavy cattle? That would be bullish.
  2. Too wet in Southern Brazil. Does this cause production issues? Fungus in soybeans, planting delays, harvest delays, mold, etc.
  3. Too dry in northern Brazil. Does this impact soybean yields in Mato Grosso and areas to the north? These states produce 1/3 of the soybeans in Brazil.

These are the questions that will keep our ag markets on edge for the next several months. And the highest ocean temps ever keeps the term SUPER EL NINO in the news a lot more often, whether we like it or not.

If you happen to want to read more on El Niño and La Niña, here are some good sources:

As always, I welcome any and all questions/comments.

Chris Myers
M6 Capital Management, LLC
Germantown, TN

chris@m6-capital.com

Published in full with permission as an archived sample. Subscriber editions are licensed to the recipient only and may not be forwarded or redistributed.

Interested in the daily letter? Ask Chris about joining

Keep reading
  • Daily Letter Archived sample

    Daily Market Letter: September 23, 2026

    The CBOT is fully expecting an ag trade deal this week, but US Trade Rep Greer’s comments that China is already fulfilling its agreement cast doubt on the $17 billion ever happening. Corn is all dressed up with record speculator length ahead of the Trump-Xi meeting, and Brazil’s planting weather is worth watching.

  • Daily Letter Archived sample

    Daily Market Letter: September 22, 2026

    CBOT grains rallied on Treasury Secretary Bessent’s comments about positive trade talks with China, but export basis was steady to lower, so Chris reads the move as mostly speculators buying corn futures. With the soybean condition rating unchanged for five weeks, which historically has meant the yield is not getting smaller, he says that longer term it is beginning to look like rallies are to be sold.

  • Special Report Archived sample

    Major Question for Next Week: Will China Buy More US Ags?

    Ahead of next week’s US-China meetings, Chris asks whether China will agree to buy $17 billion of US ag goods a year, weighing three themes that point toward no ag deal against three that suggest one may occur. His table of US ag exports to China since 2015 sketches what $17 billion could include; if it happens and China follows through, he calls it bullish US corn, soybeans and wheat.

All sample letters and reports